ISF Group benchmarks seafarer wages across nationalities, ranks, and vessel types. I redesigned their wage platform and designed two decision tools on top of that data — a wage prediction tool and an annual crew budgeting tool — so companies can compare markets, see where wages are heading, and plan what a crew will cost.
ClientISF Group
Timeline3 Months
RoleUX Designer (freelance)
TeamProject managers, engineers, data scientists
The background
ISF Group runs a global seafaring wages benchmarking survey. Participating shipping companies report wages for officers, ratings, and trainees across nationalities and vessel types, along with the benefits they offer each year. That data is only as useful as the platform companies use to read it.
The challenge
The data was rich; the experience of using it was not. Insight lived in dense survey tables, and answering everyday questions — how does pay for a Master on an oil tanker compare across nationalities? what will this crew cost next year? — meant manual digging and spreadsheet work.
ISF set two goals for the engagement:
Redesign the platform to improve usability, visual clarity, and task efficiency.
Align the experience with both business goals and the needs of the companies using it.
The approach
01
Discovery
Kicked off with a platform audit, a stakeholder interview, a competitive analysis, and a pass through ISF’s brand identity — then defined who the users were and framed the problem and design goals.
02
UX concepts
Redesigned the information architecture and navigation, mapped the key tasks into clear user flows, and sketched low-fidelity wireframes for the new tools.
03
Iteration
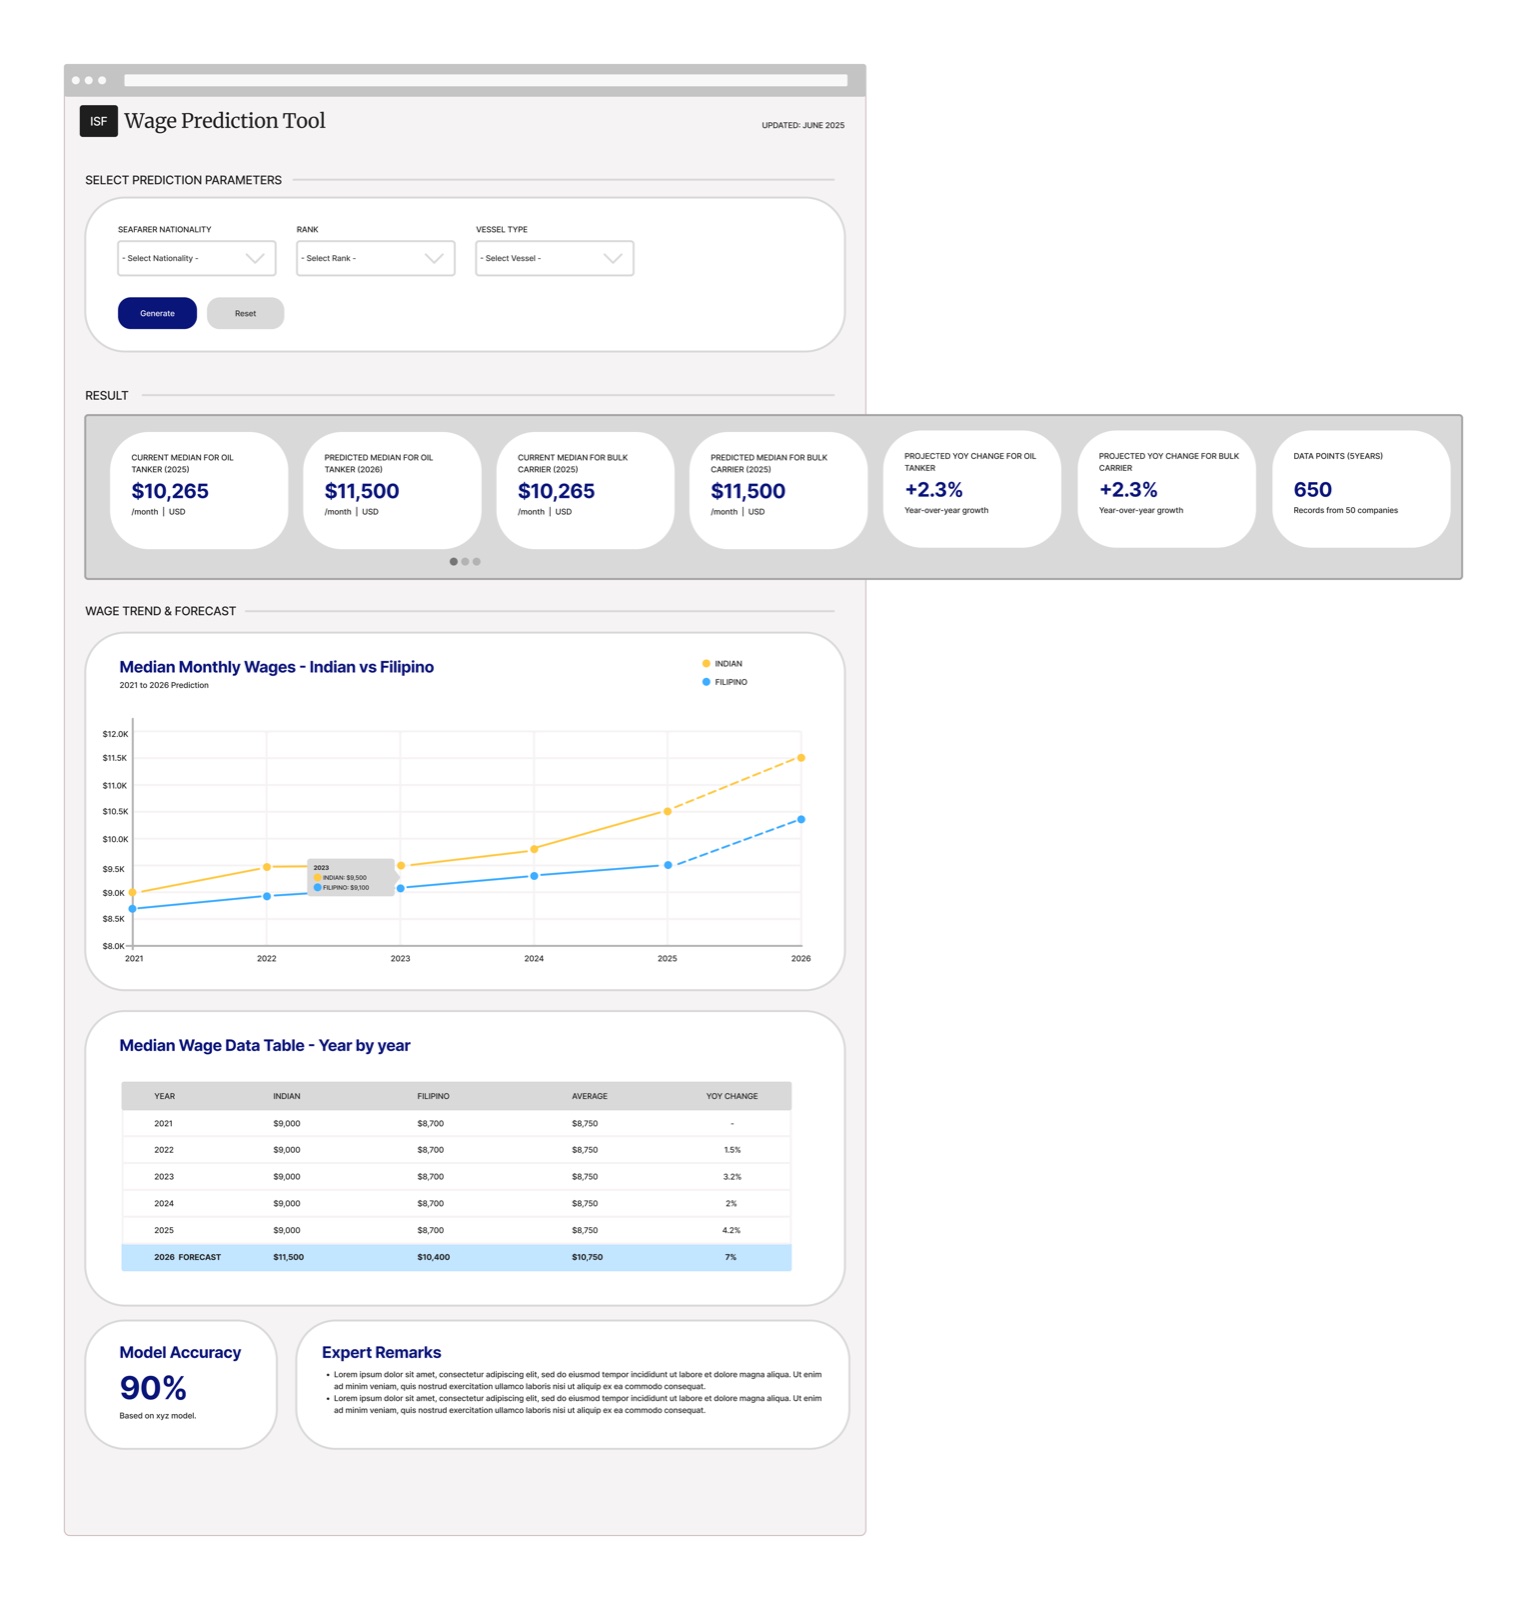
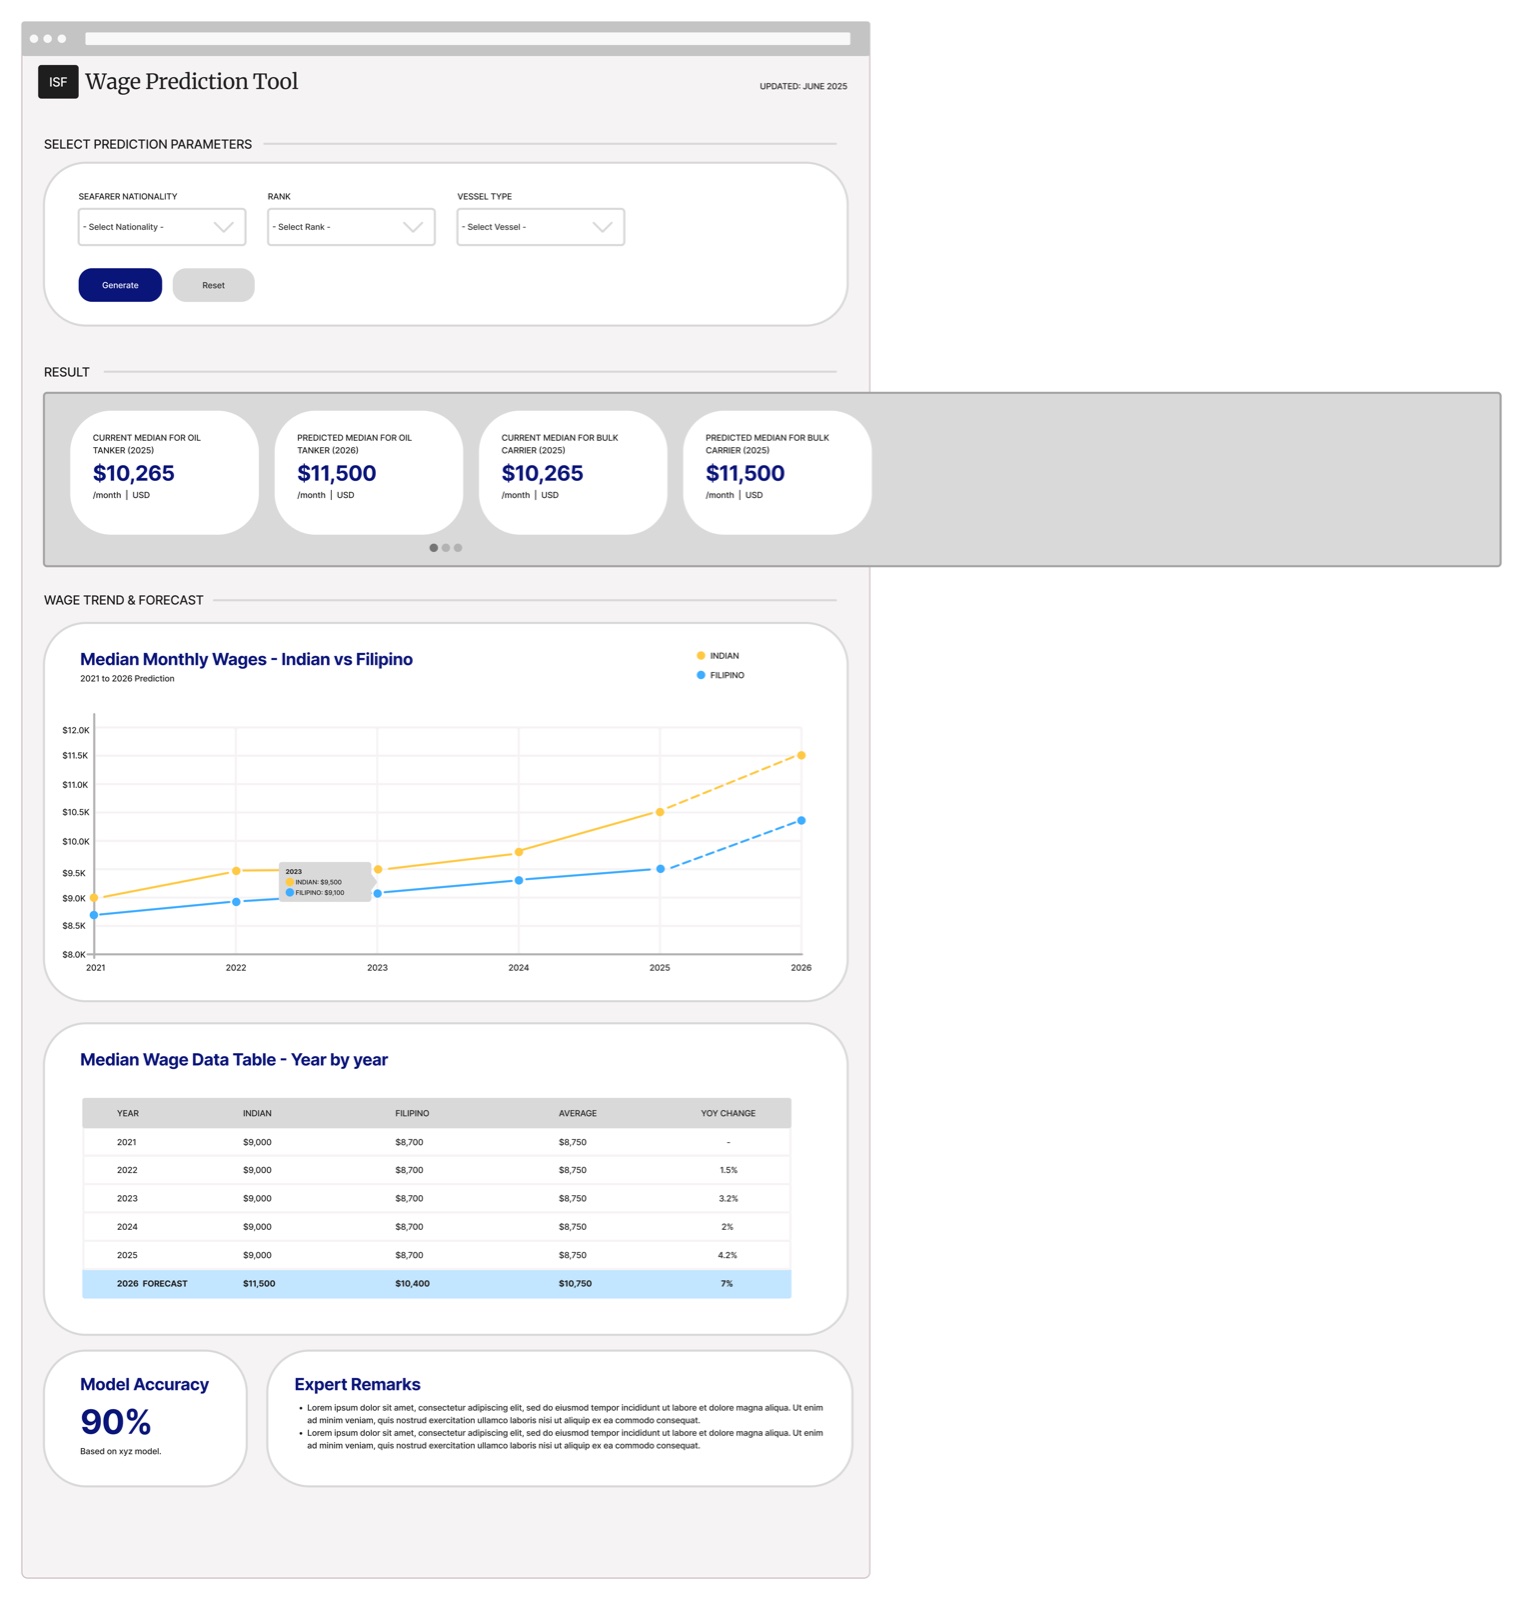
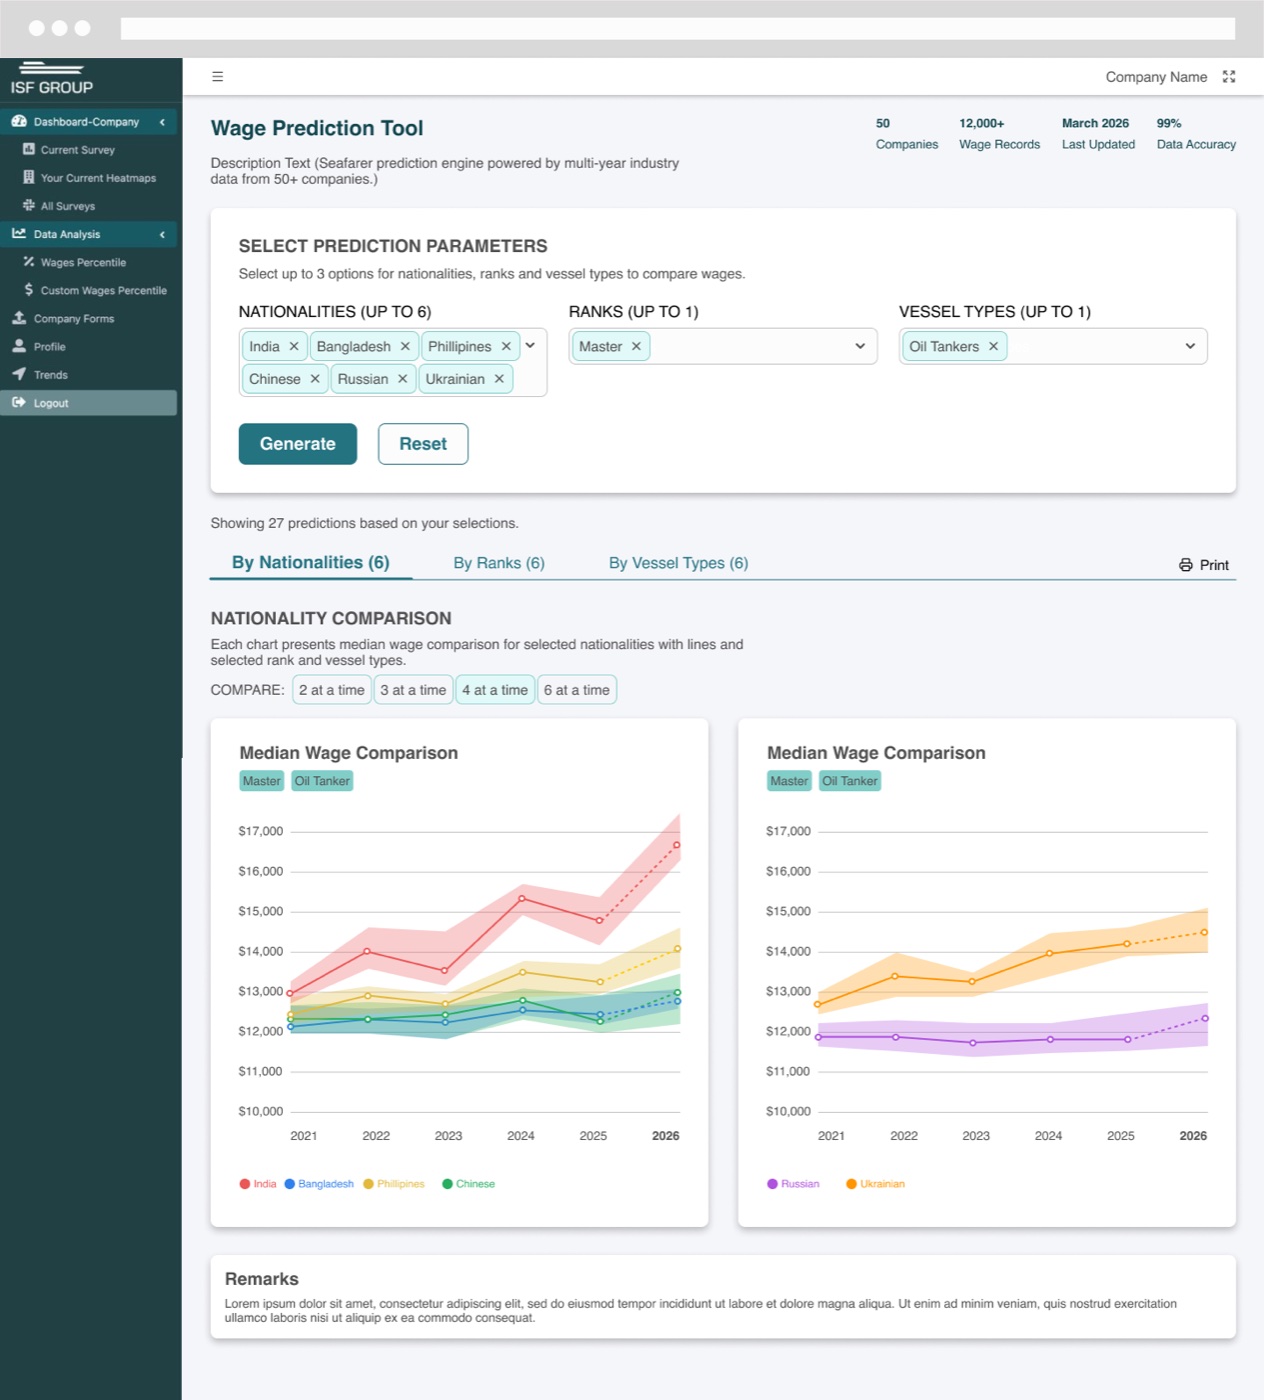
Explored several ways to present multi-dimensional comparisons — how many charts per view, and how to group lines — refining toward a layout that stays readable as selections grow.
04
Visual design & handoff
Built high-fidelity designs in Figma in ISF’s visual language and tested the flows — working closely with project managers, engineers, and data scientists so the designs matched what the prediction models and data could support.
Wage prediction tool
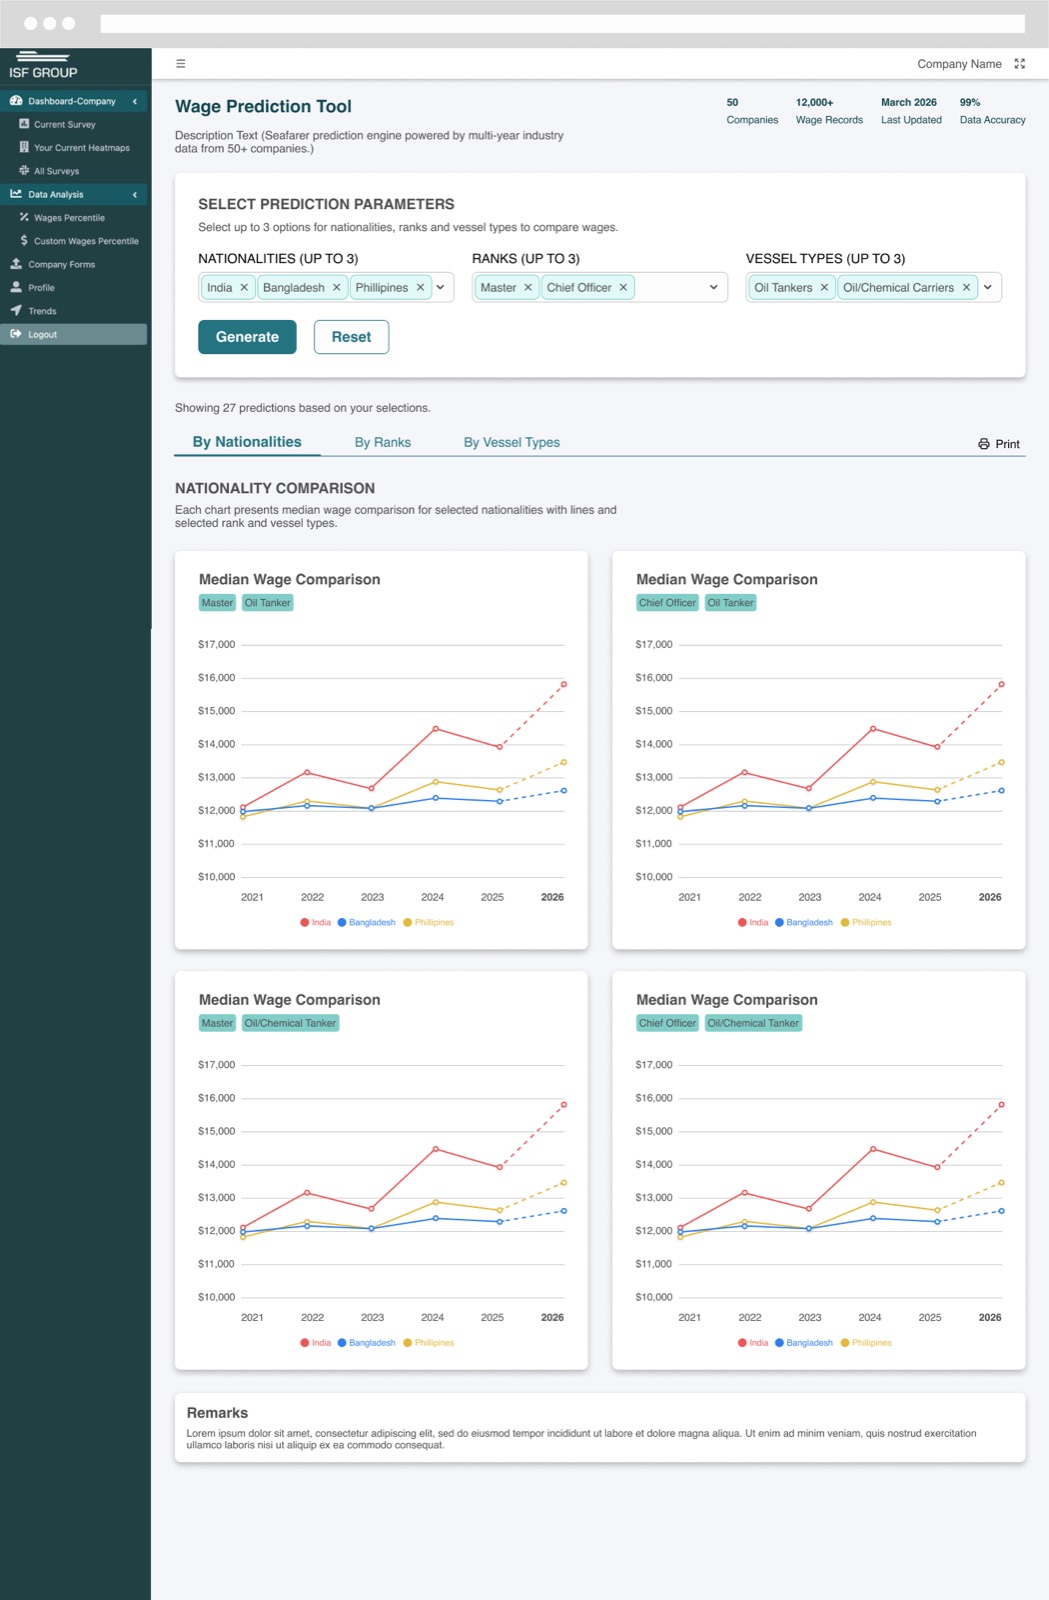
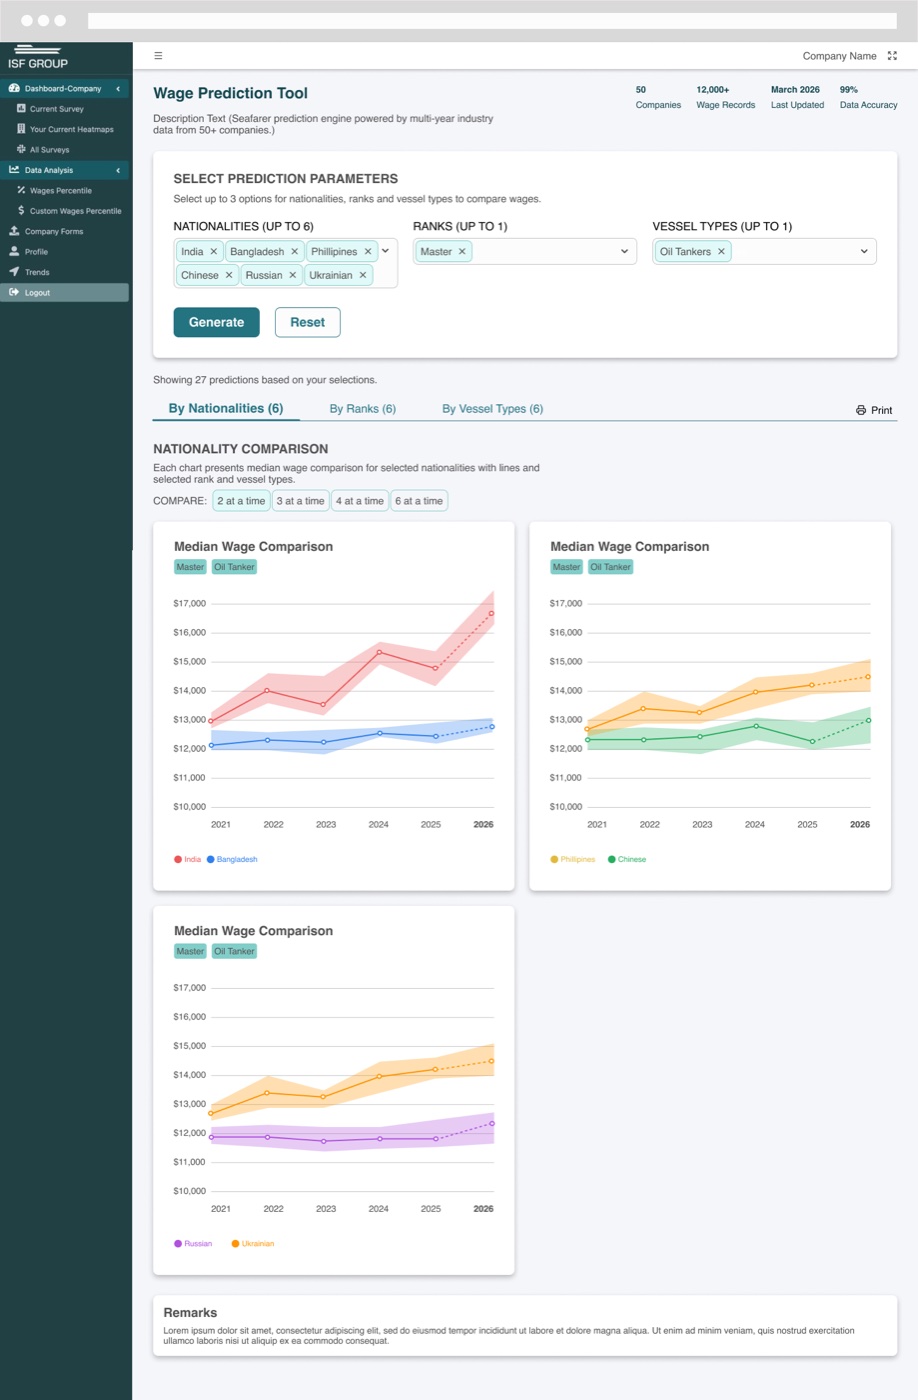
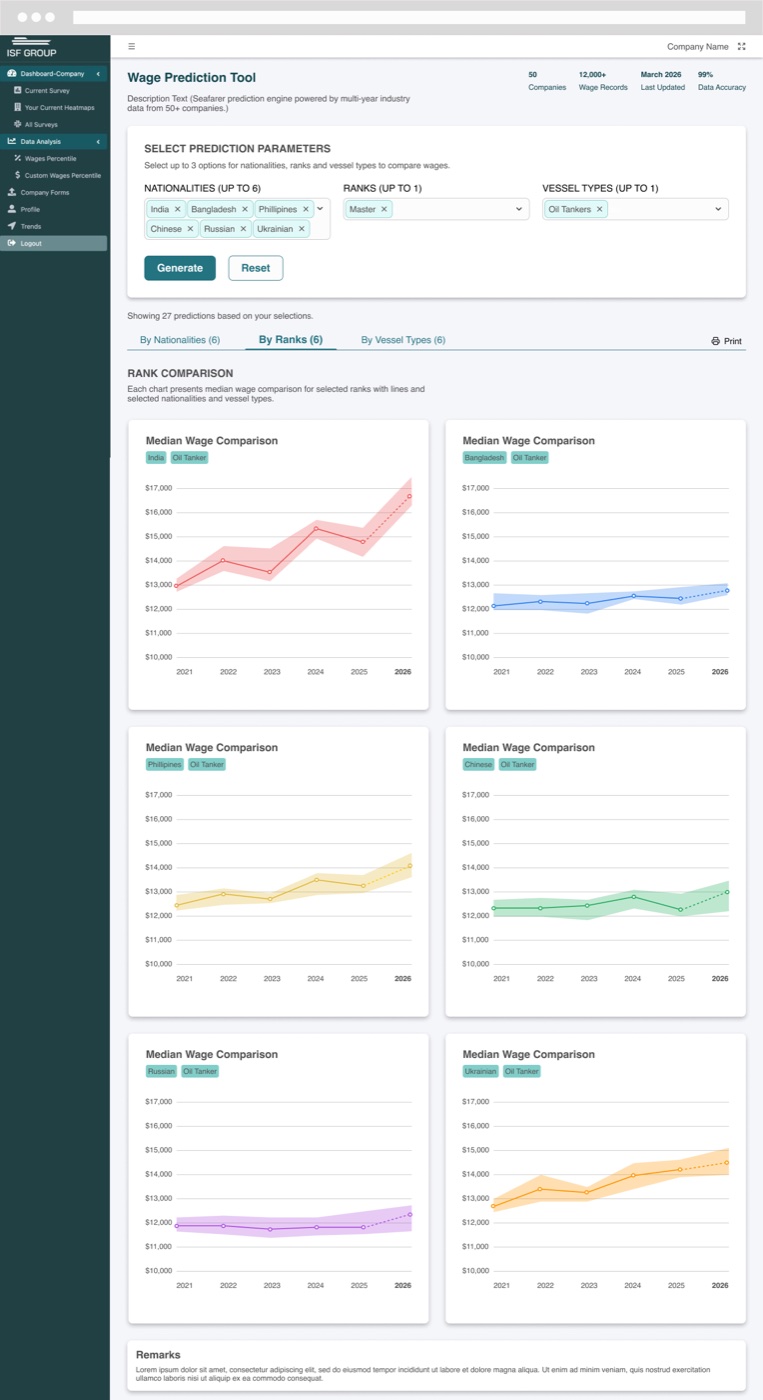
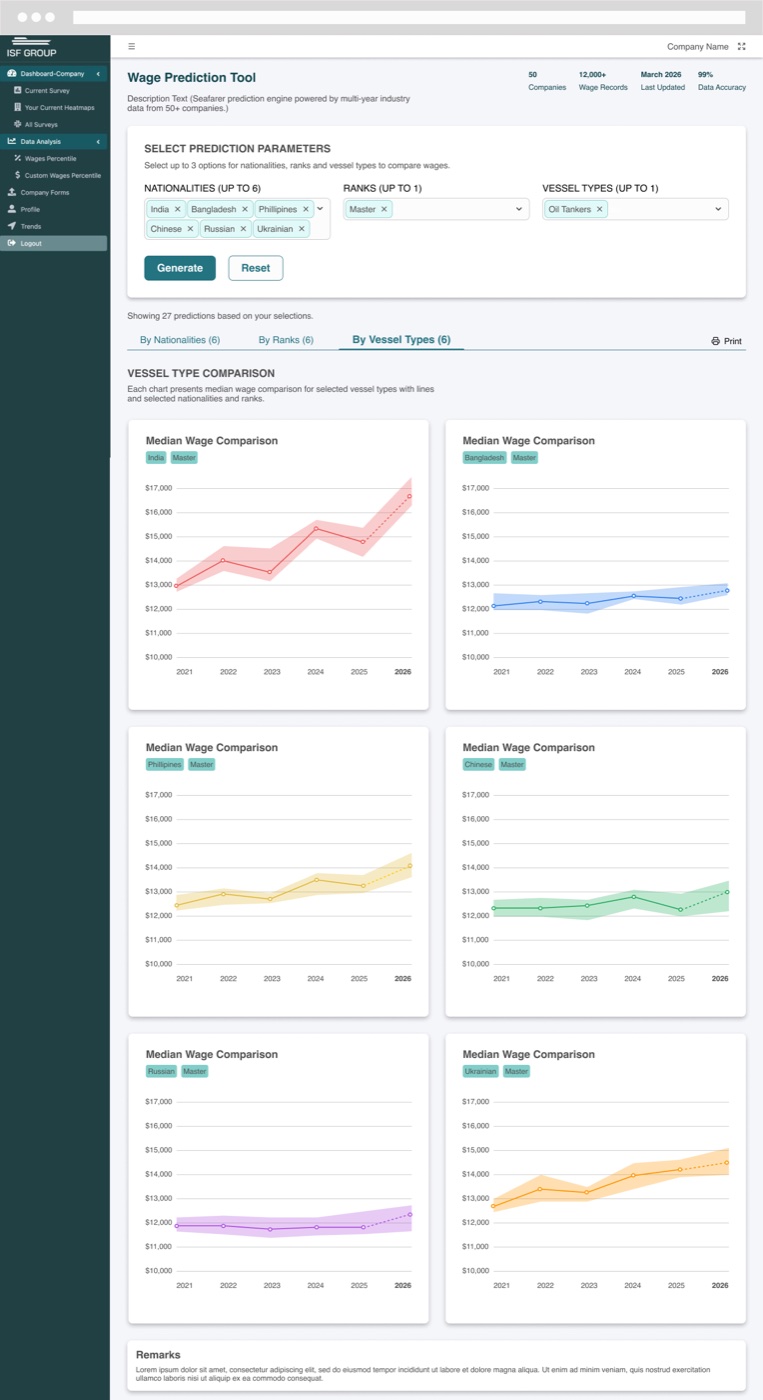
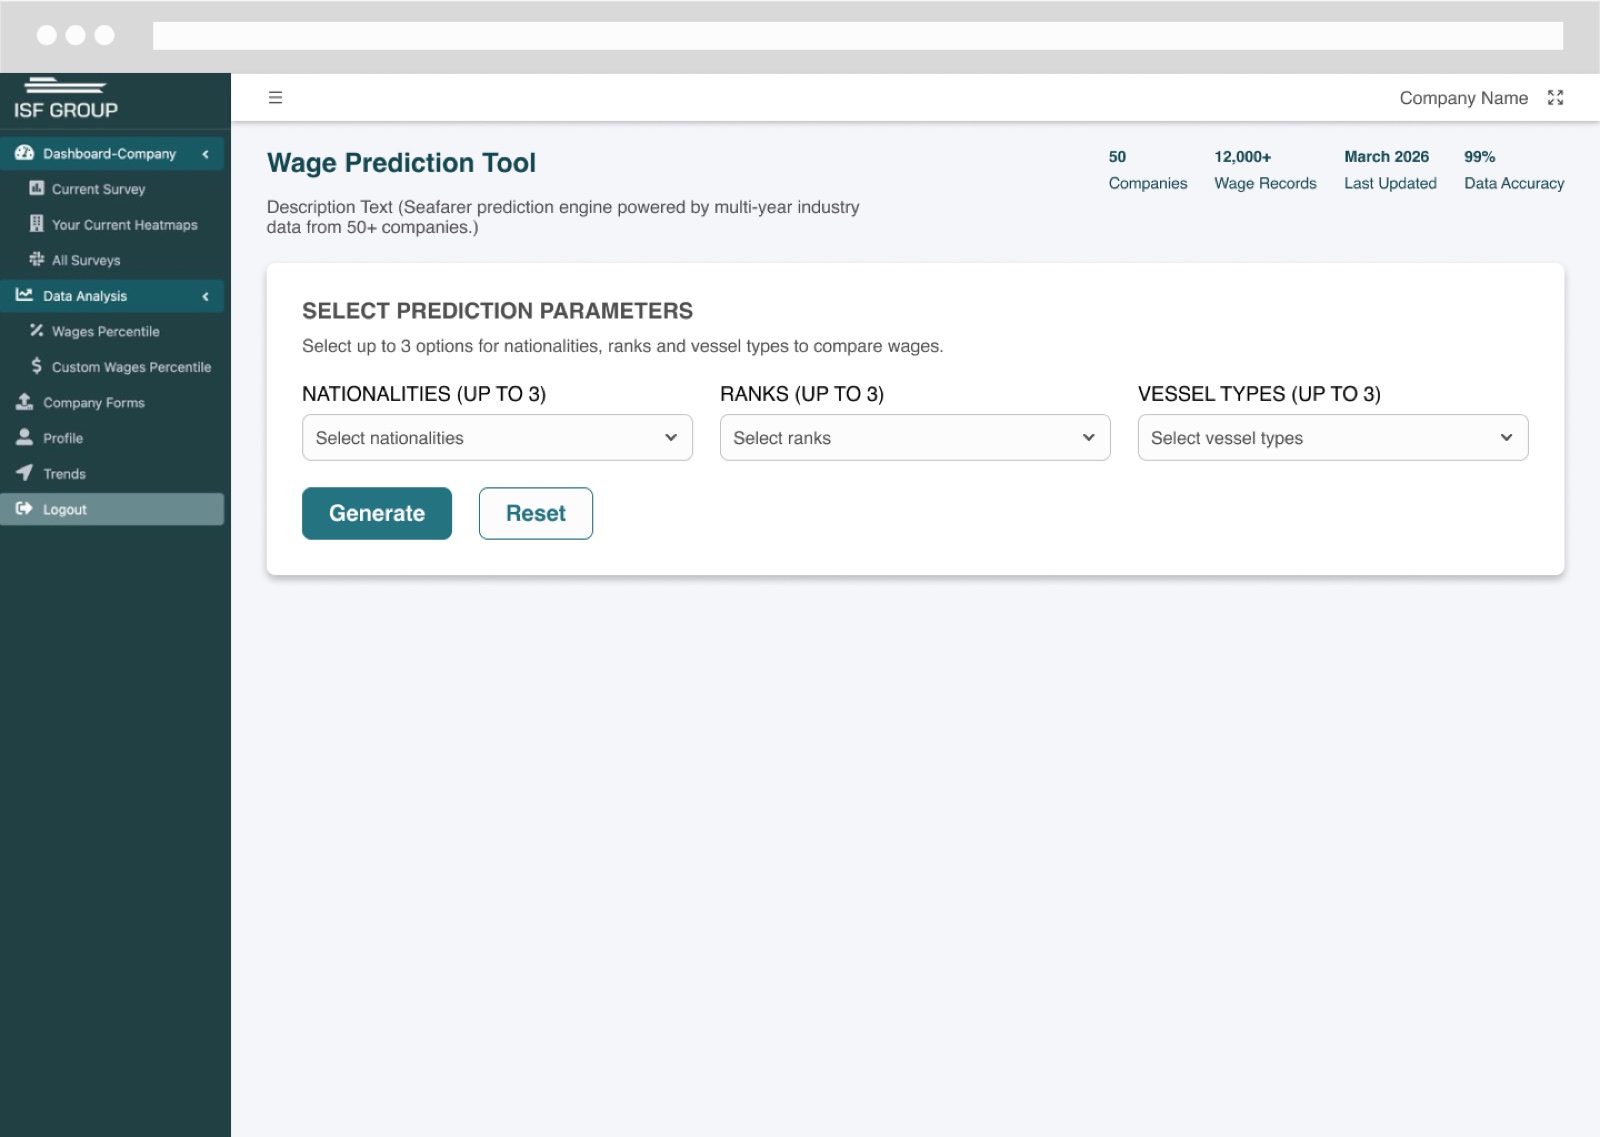
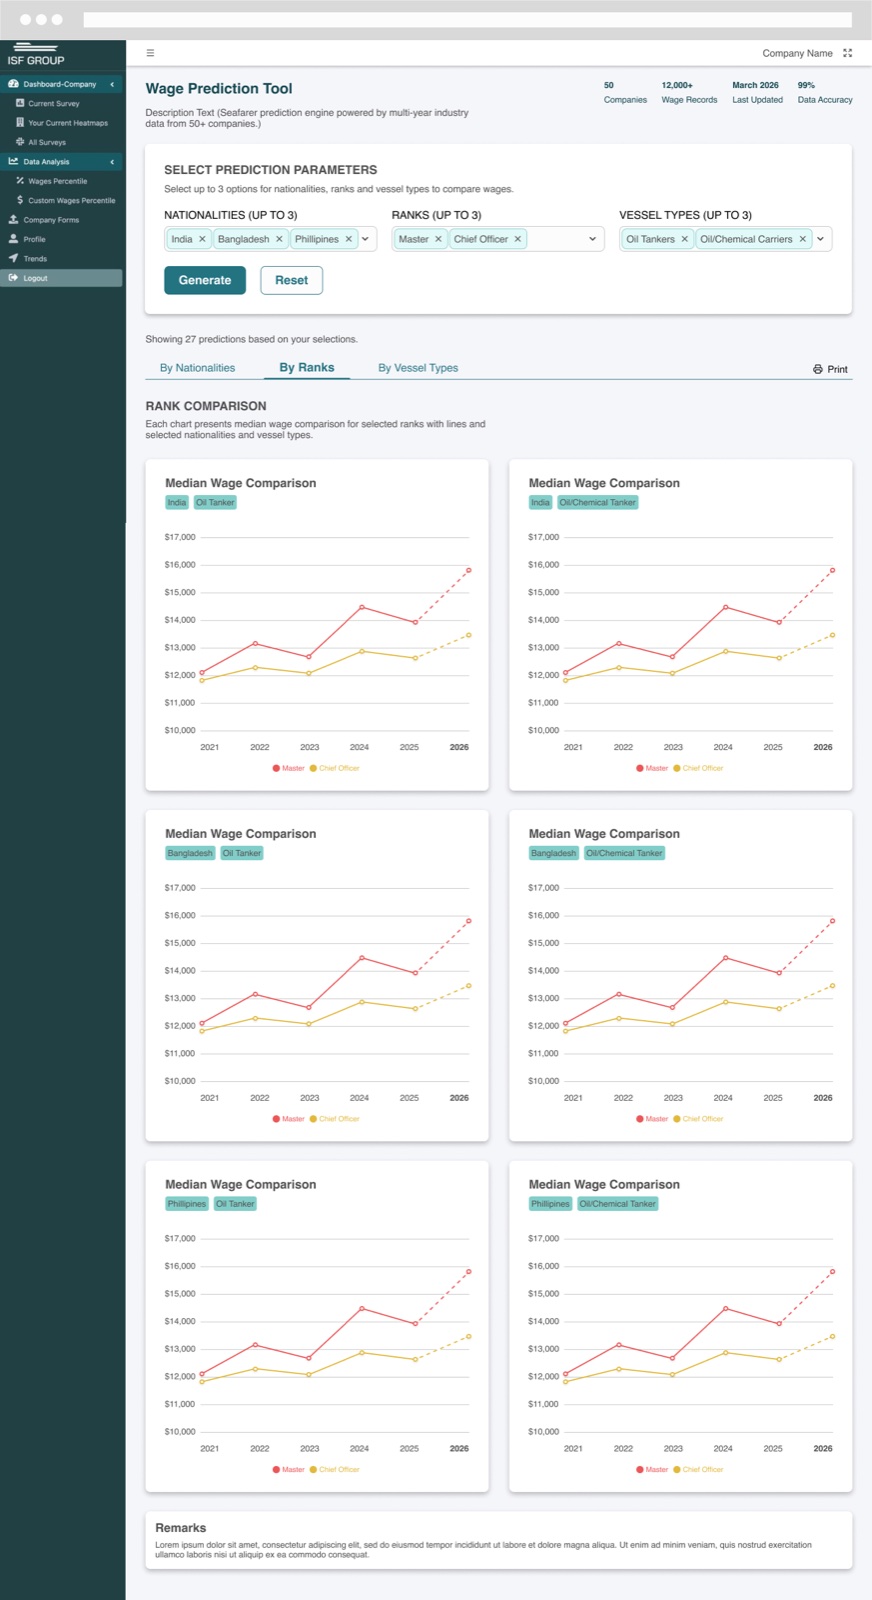
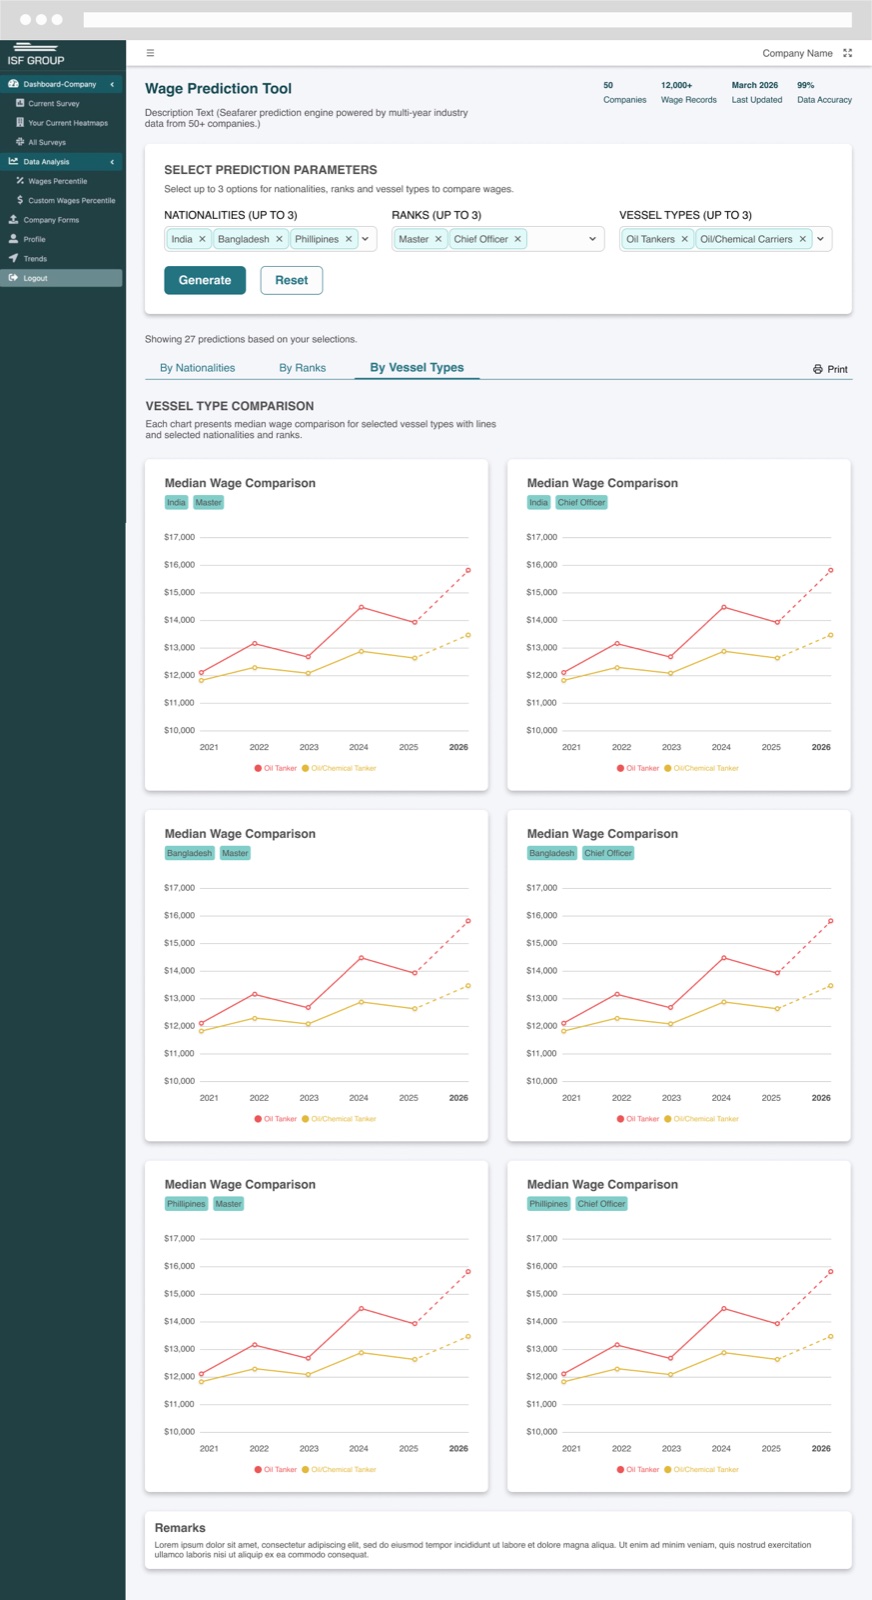
Companies select up to three nationalities, ranks, and vessel types, and the tool generates median wage trends for every combination — with a dashed projection showing where wages are heading. Results can be viewed by nationality, by rank, or by vessel type, so one dimension is compared at a time while the others stay fixed.
Finding the right layout
Early iterations tested how much to show at once — one dense chart versus small multiples, and how to group comparisons. Small multiples, grouped by the dimension being compared, kept each chart legible even with 27 predictions on screen.
The final design
A focused parameter panel up top, clear tabs for each comparison view, consistent color per nationality across every chart, and a one-click print view for sharing.
Selecting up to three nationalities, ranks, and vessel types.Median wage trends by nationality, with the projected year shown as a dashed line.
Annual budgeting tool
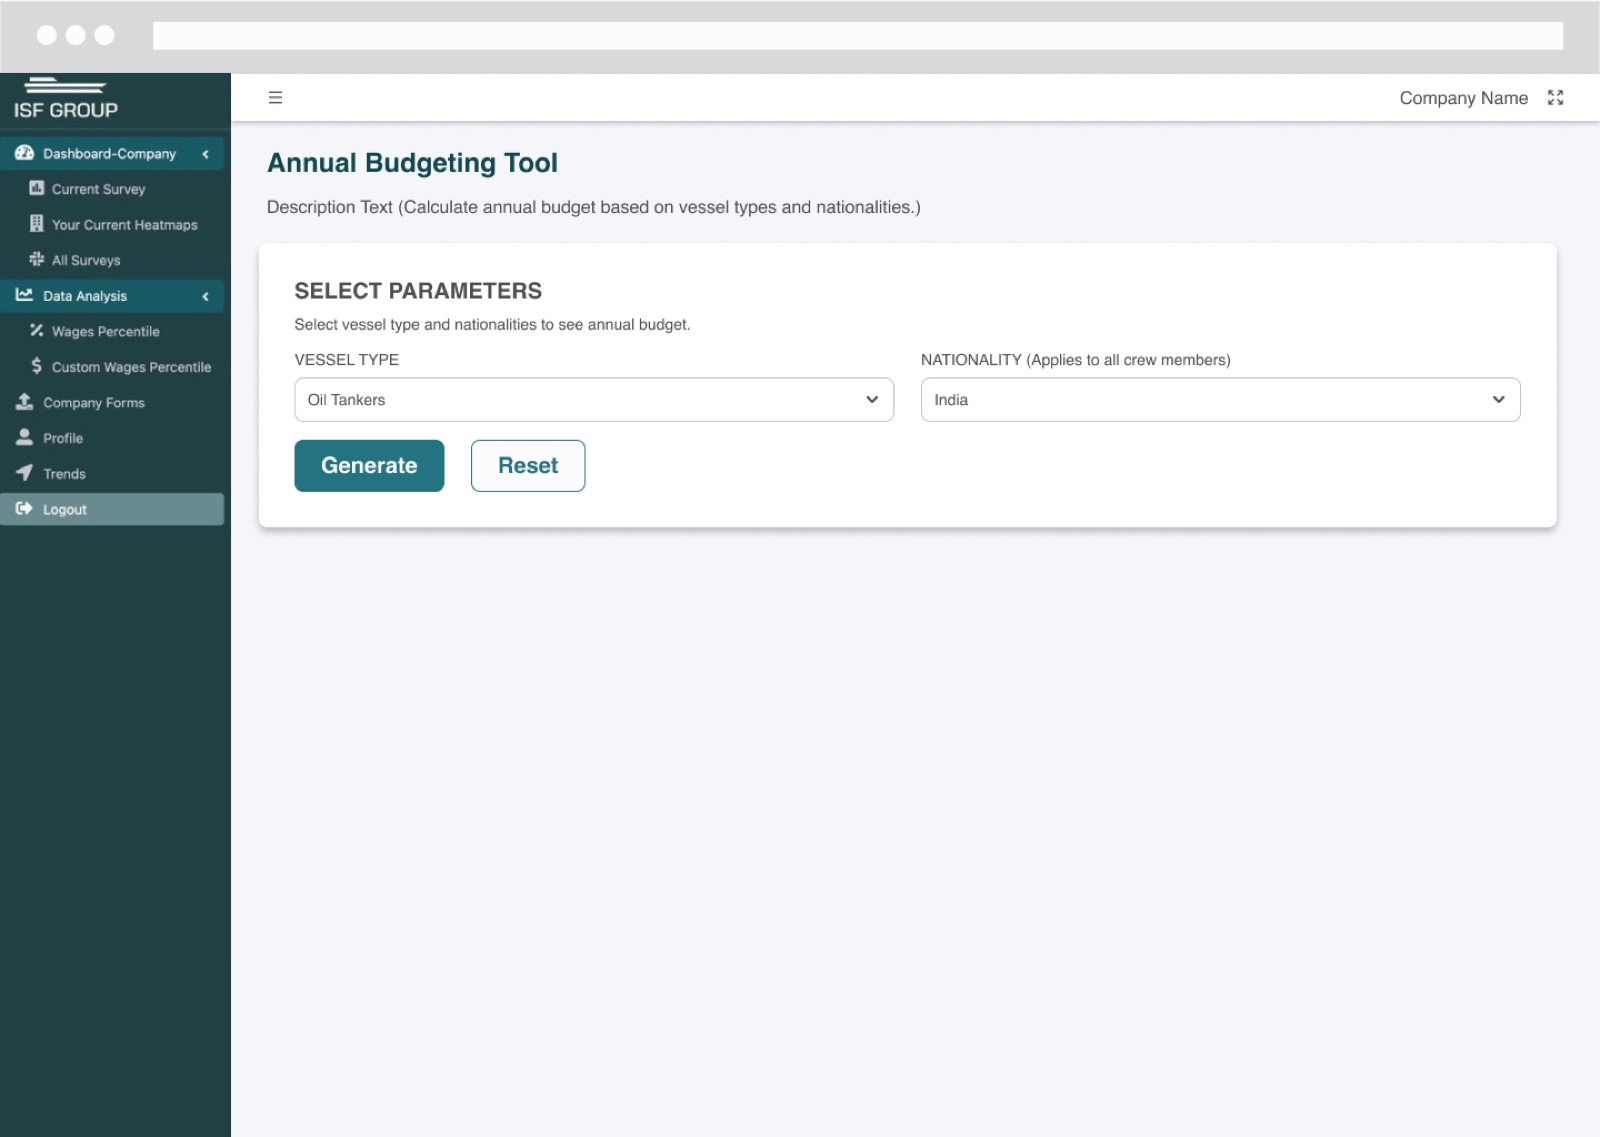
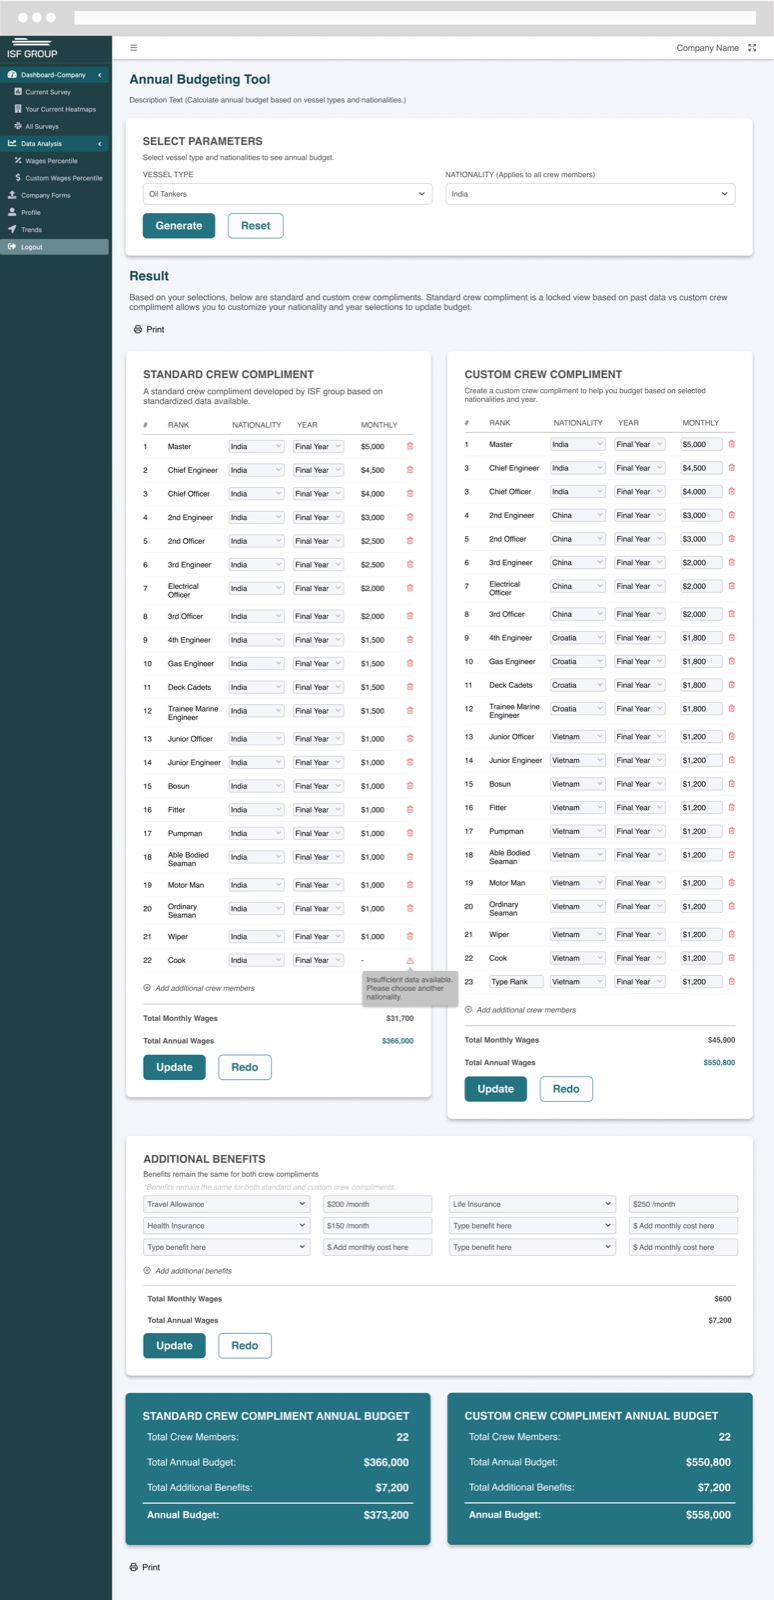
The second tool answers the question that follows: what will a crew actually cost? Companies pick a vessel type and nationality and get two budgets side by side.
Standard crew complement
A locked view built from ISF’s standardized data — a reliable baseline for a typical crew on that vessel type.
Custom crew complement
An editable version where companies can change nationality and experience level rank by rank, add crew members, and watch the budget update.
Additional benefits
Benefits such as travel allowance and insurance are added once and applied to both budgets, so the comparison stays fair.
Honest about gaps
When there isn’t enough data for a selection, the tool says so inline and suggests choosing another nationality — instead of showing a misleading number.
Two inputs — vessel type and nationality — to generate a budget.Standard vs. custom crew complement, additional benefits, and annual budget totals side by side.
The result
A wage platform that turns a benchmarking survey into a planning instrument. The wage prediction designs were approved for build, and the annual budgeting tool shipped as its first version — giving companies a way to compare markets side by side, see where wages are heading, and model crew costs before they hire.